Click here to view recent plots of VLF stations DHO, JXN, NAA, NLK, NPM, NWC and many more.
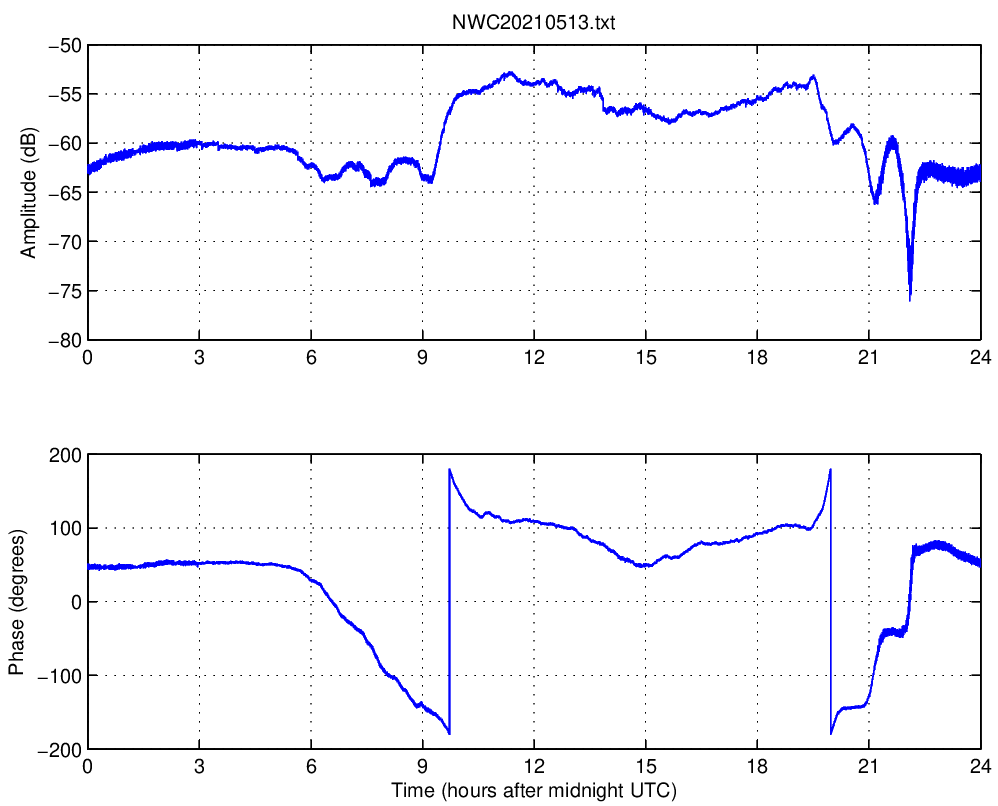
These VLF data plots were obtained using UltraMSK. All signals were received in Dunedin, New Zealand, using a vertical electric field antenna. Each plot has a title of the form XXXYYYYMMDD.txt where XXX is the transmitter call sign and YYYYMMDD is the date. All times and dates are given in UTC.
Interested in setting up your own UltraMSK receiver? The UltraMSK system requirements section has more information.